7 Tips for Choosing the Best Solar Packages?

Choosing solar packages is not just a matter of comparing panel counts. The package must fit your roof, electricity use, budget, and tolerance for maintenance. IRENA’s Renewable Power Generation Costs in 2023 report found that the global weighted-average cost of electricity from new utility-scale solar fell to $0.044 per kilowatt-hour. That figure is useful context, not a promise about household savings: residential prices depend on local labor, equipment, financing, and site conditions.

IEA Executive Director Fatih Birol called solar “the new king of electricity markets” in the agency’s Renewables 2020 report. The wider shift is real. Yet the best choice for one home may disappoint another. A shaded roof, an undersized inverter, or a battery you rarely use can change the value of a solar package. Small details matter.

This guide’s seven tips will help you compare equipment, installation terms, warranties, and realistic production estimates. Ask for the panel and inverter models, not just a glossy brochure. Check whether the quote explains roof work, monitoring, and battery capacity in plain language. Then compare projected output with your past electricity bills. Be cautious with confident savings claims; weather and household habits vary. I would not treat any checklist as magic. A careful review can still miss something. But asking better questions makes it easier to spot gaps before signing and to choose a system suited to your home.

7 Tips for Choosing the Best Solar Packages?

Assess Annual Electricity Use and Estimate Site Yield with NREL PVWatts

Before comparing solar packages, gather 12 months of electricity bills and note seasonal peaks. The U.S. Energy Information Administration reported average household electricity use of 10,791 kWh in 2022. That figure is a benchmark, not a target: air-conditioning, electric vehicles, and heating can shift a home’s demand considerably. NREL’s PVWatts calculator estimates annual solar production using location, system size, and other inputs. Small differences matter. Enter realistic roof direction and tilt, then compare estimated output with your actual yearly use.

Check the assumptions, too. PVWatts is a planning tool, not a roof inspection; nearby trees, chimney shade, snow, and wiring losses can change real production. Run estimates for plausible system sizes, and review monthly output rather than relying only on one annual total. A neat yearly match can still leave winter bills high or create summer surplus. I would treat the result as a starting point, then ask an installer to verify roof conditions and shading on site. It is easy to over-trust a clean estimate. Compare the package’s expected production with your usage pattern, not just its headline system size.


Compare Panel Warranties with NREL’s 0.5% Median Annual Degradation Rate

When comparing solar packages, look beyond the warranty’s headline length. NREL researchers reviewed thousands of photovoltaic degradation rates and reported a median near 0.5% per year. At that pace, a panel would retain about 88% of its original output after 25 years. That is a benchmark, not a promise for your roof.

Read the fine print. Check the guaranteed output at year 25, whether the warranty covers labor and removal, and how claims are measured. A package promising 80% after 25 years may offer less protection than one with a higher guarantee, but only if its terms are practical. Ask for the exact model’s performance warranty and the test conditions behind its figures. Shade, heat, dust, and installation quality affect real-world production. NREL’s median cannot predict one home’s results.

A warranty is not a production forecast. It may also require documentation that homeowners do not keep. Save the contract, installation records, and annual monitoring reports. Compare the remedy, too: replacement panels alone may not cover the cost of accessing them. The details matter.

7 Tips for Choosing the Best Solar Packages? - Compare Panel Warranties with NREL’s 0.5% Median Annual Degradation Rate

# What to Compare Useful Data or Check How to Use It
1 Panel degradation rate NREL’s review reported a median PV module degradation rate of about 0.5% per year. Compare each package’s stated annual degradation with this research benchmark; it is a fleet-level median, not a guarantee for an individual system.
2 Long-term output guarantee At a constant compounded annual decline, estimated output remaining after 25 years is about 88.2% at 0.5% per year, 90.5% at 0.4%, and 92.8% at 0.3%. These are illustrative calculations using (1 − annual degradation rate)25, not product promises. Check the actual guaranteed output at each warranty year.
3 Product warranty Read the stated coverage period and the covered defects, such as materials or workmanship, in the written warranty. Compare coverage terms directly; do not assume a performance warranty also covers product defects or labor.
4 Warranty exclusions and remedy Check exclusions, claim deadlines, required documentation, and whether the remedy is repair, replacement, or reimbursement. Ask who pays for diagnosis, shipping, removal, and reinstallation; these costs may be treated separately from the panel itself.
5 System size and estimated production Compare the proposed system capacity in kW and estimated annual generation in kWh, along with the assumptions behind the estimate. Check that roof orientation, shading, local weather, and expected system losses are reflected consistently across quotes.
6 Package scope and price Review the itemized quote for panels, inverter(s), mounting, installation, electrical work, permits, and any optional storage. Compare total installed cost and inclusions, rather than comparing a headline price alone.
7 Installer and service responsibilities Confirm who handles installation, system monitoring, warranty claims, and post-installation service, and get these responsibilities in writing. Check applicable licenses and local requirements, and ask how service requests are handled if the original installer is unavailable.

Reference: NREL’s review of photovoltaic module degradation rates reported a median rate of approximately 0.5% per year. Estimated 25-year output figures above are mathematical illustrations, not warranty terms or predictions for a specific installation.

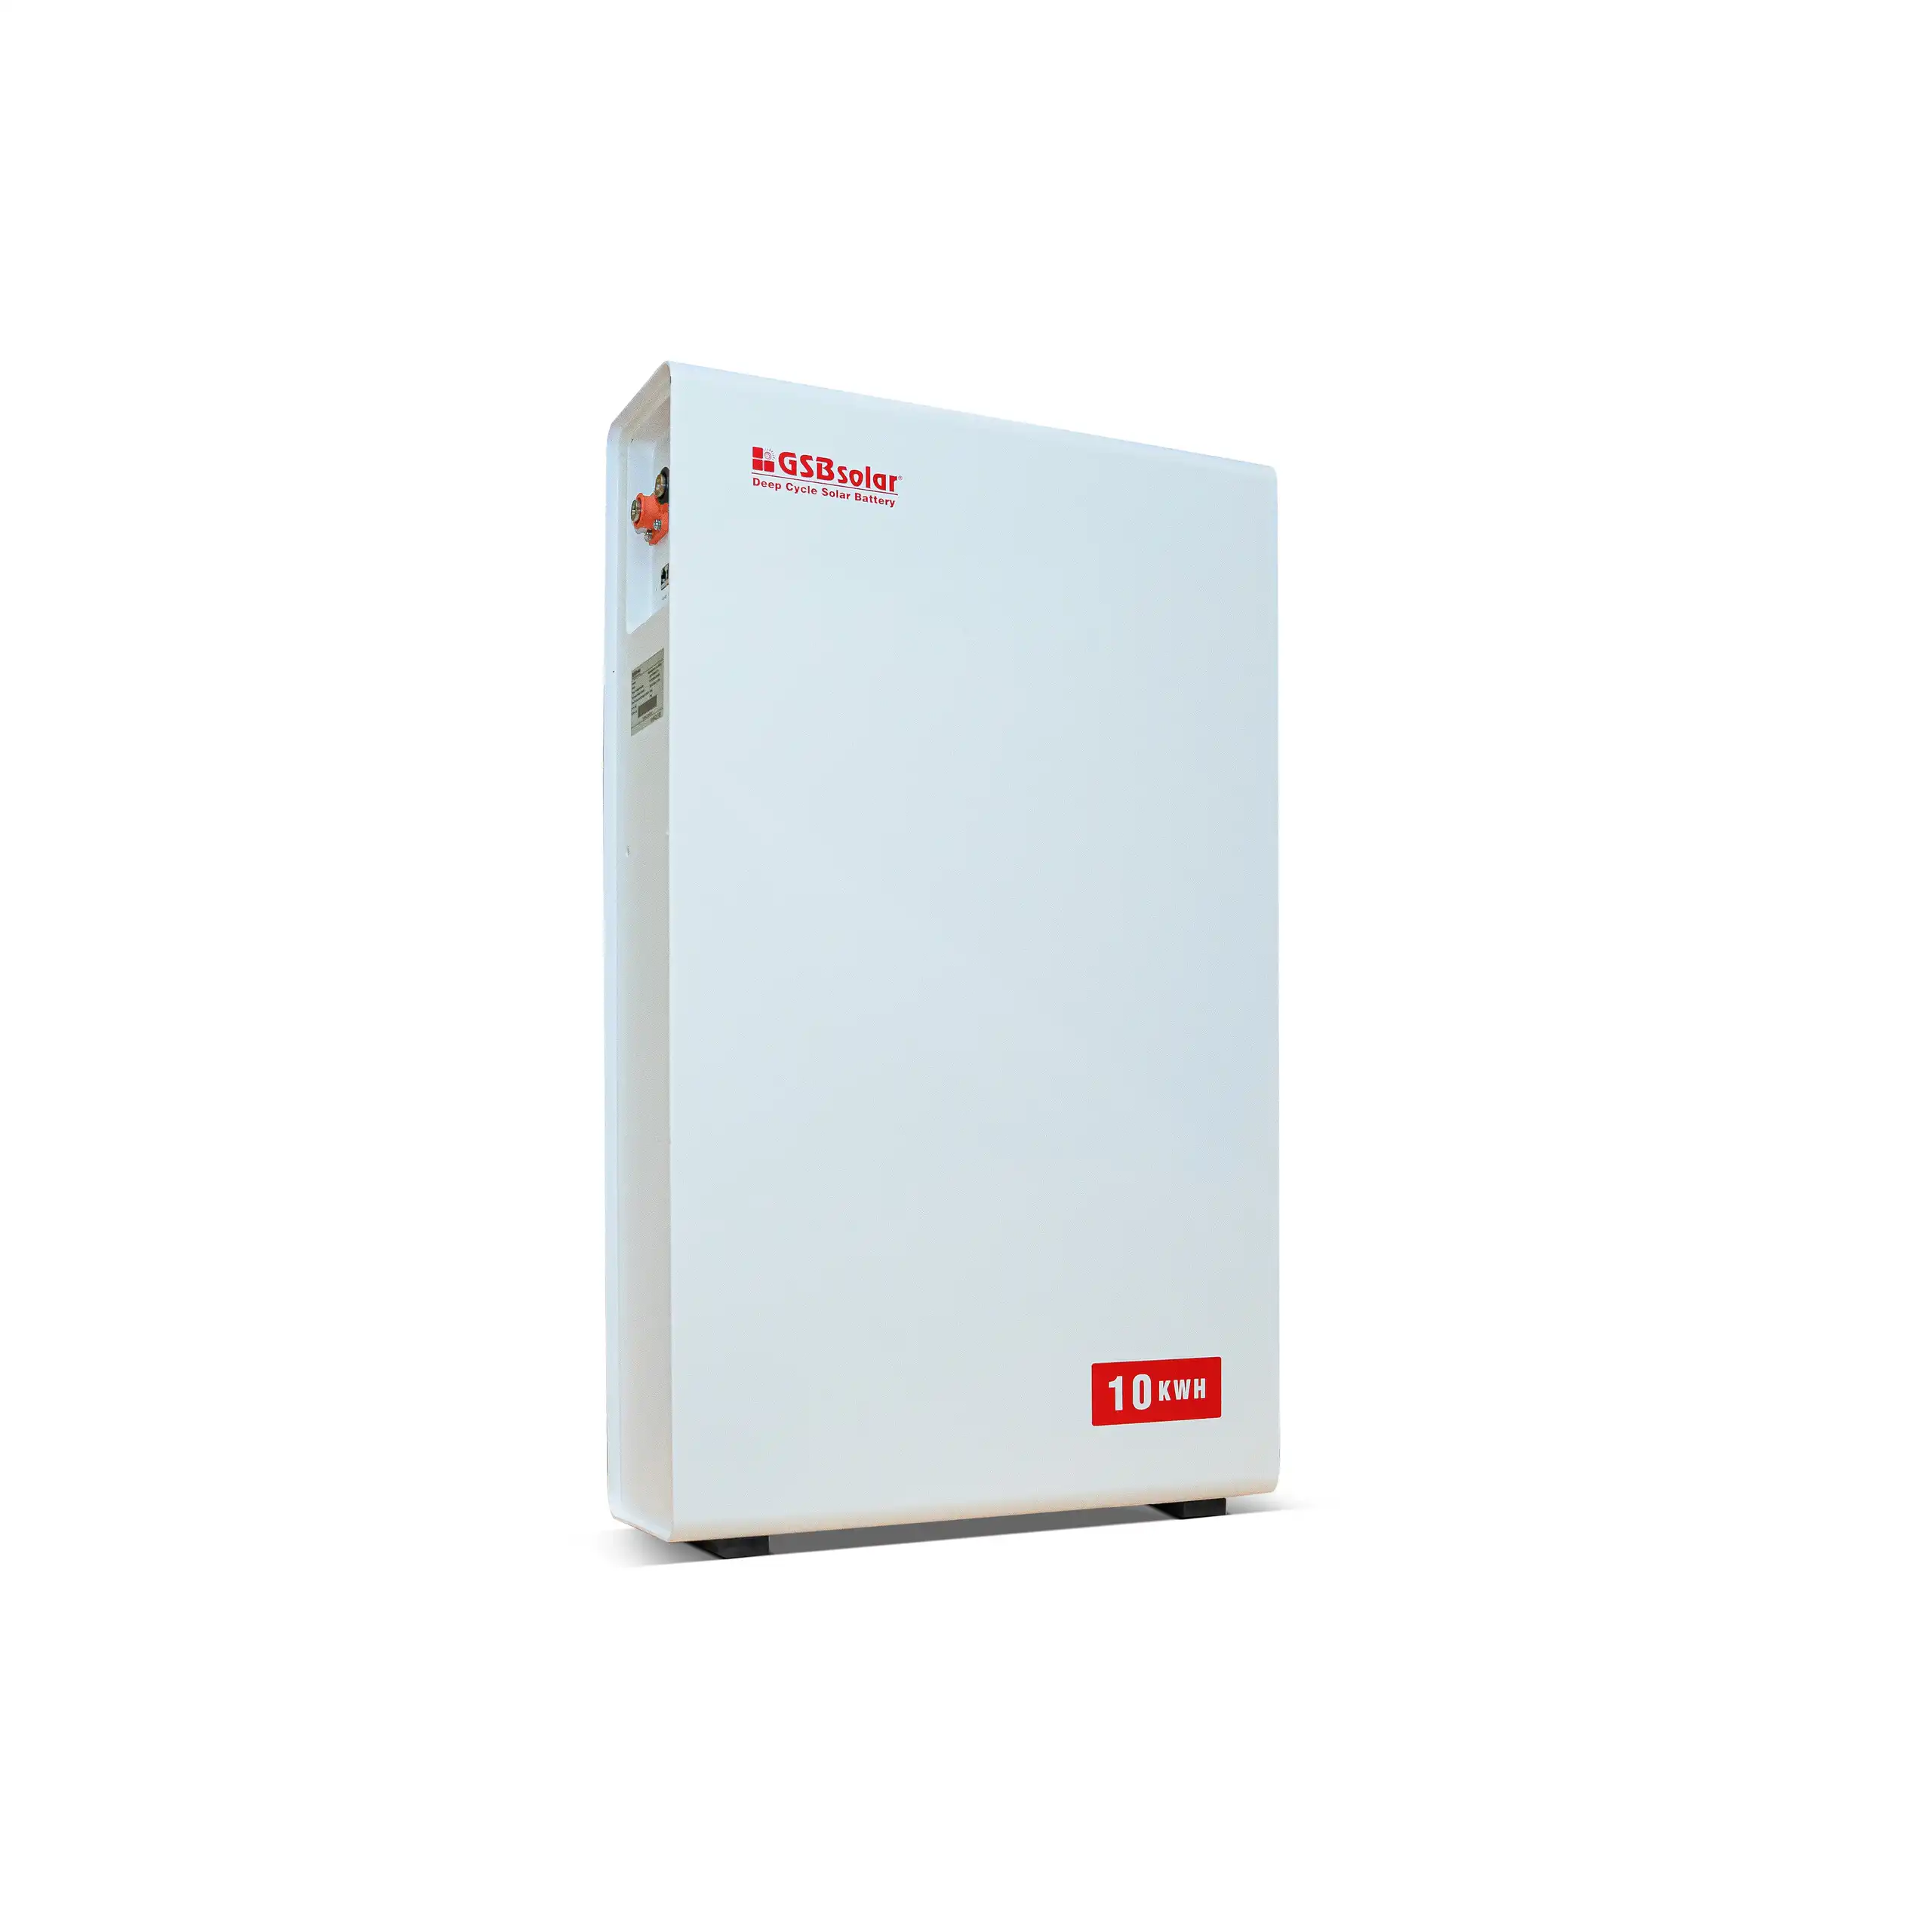
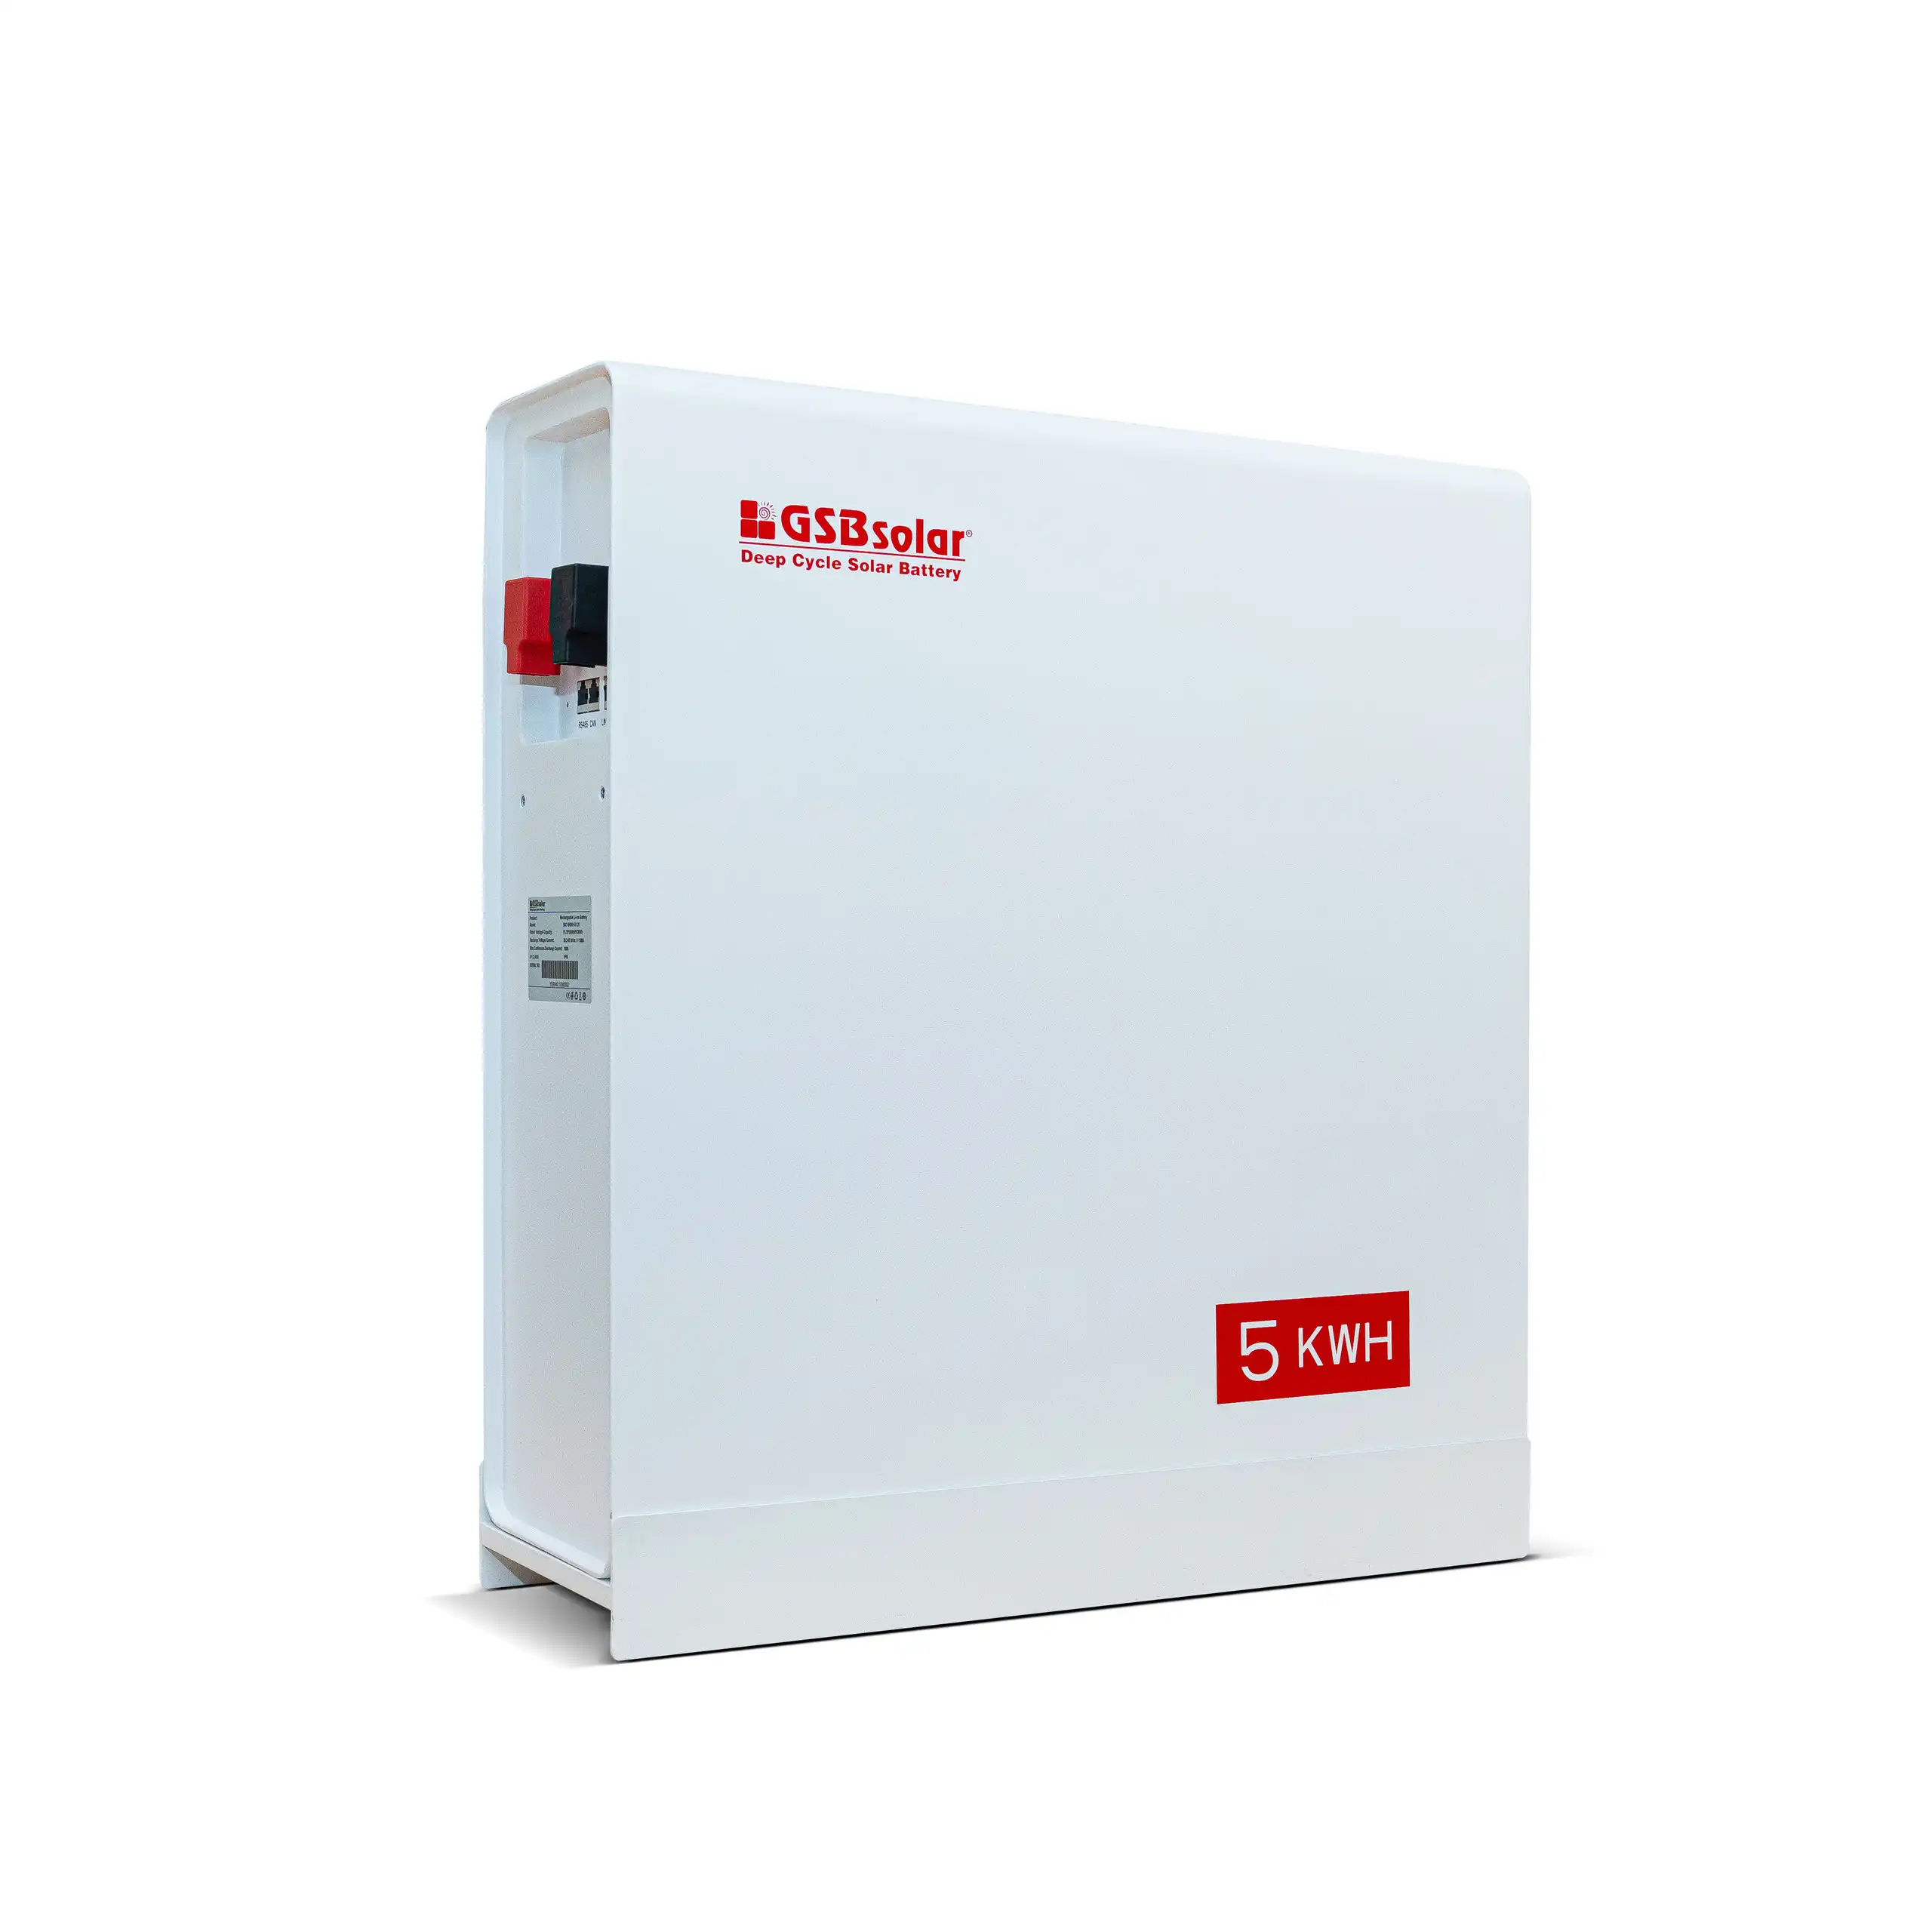
Evaluate Battery Options Against the 85–95% Lithium-Ion Efficiency Range

A battery’s advertised capacity is not the same as usable energy. Round-trip efficiency measures how much electricity remains after charging and discharging. The U.S. Department of Energy’s 2022 Grid Energy Storage Technology Cost and Performance Assessment places lithium-ion systems around 85–95% efficiency. NREL’s 2024 Annual Technology Baseline uses an 85% round-trip efficiency assumption for utility-scale batteries. Different test conditions and system boundaries explain some of that spread.

Tip: Compare usable kilowatt-hours, not just the battery’s nameplate capacity. Ask whether the quoted efficiency is measured at the cell, battery, or whole-system level. For example, an 85% efficient system returns about 8.5 kWh from 10 kWh stored, before considering household load timing. Check warranty terms, operating temperature limits, and whether efficiency includes the inverter. Small losses add up.

For a home package, match battery size to evening demand and expected outage needs. Review the daily energy profile: a refrigerator, lights, and a router draw less than heating equipment or an electric vehicle. Ask for modeled seasonal performance, not just a sunny-day estimate. A higher efficiency figure can look reassuring, but it may not reflect your setup. I would verify the assumptions twice; installers’ estimates can miss real-world standby use.

Compare Installed Quotes with NREL Solar Cost Benchmark Data

When comparing solar packages, put every installed quote on the same basis: total price divided by system capacity in DC watts. NREL’s 2023 U.S. Solar Photovoltaic System and Energy Storage Cost Benchmark modeled residential, PV-only system costs at about $2.90 per DC watt. Treat that figure as a reference point, not a promised local price or a homeowner’s exact invoice. It reflects a modeled system and assumptions that may differ from your roof, location, and project scope. That matters.

A 7-kilowatt quote at $3.20 per watt is not automatically overpriced. Check whether it includes electrical upgrades, roof work, permitting, and monitoring, and whether battery storage is bundled in. Compare equipment capacity and warranties, too; a low headline price can hide a smaller system or omitted work. Ask for an itemized estimate, then compare each line with the benchmark’s scope. Not identical. Local labor, roof pitch, shading, and interconnection needs can shift costs substantially. I would avoid treating one national figure as a pass-or-fail test; even careful comparisons leave some uncertainty when proposals describe work differently.

Verify Installer Credentials, Equipment Coverage, and Contract Terms

A solar package can look convincing on paper, but the installer’s qualifications deserve a closer check. Ask for proof of current licenses, insurance, and relevant training, then confirm details with the appropriate local authority. Ask who will handle the installation and who you should contact if a roof leak appears later. Ask for proof. A polished proposal is not the same as a qualified crew.

Read equipment warranties carefully. They may cover panels, inverters, or batteries for different periods, and coverage can exclude labor or removal costs. Check whether the installer also provides a workmanship warranty, and ask what happens if the company stops operating. Details matter. Keep the answers in writing, especially if a salesperson makes a verbal promise.

Before signing, review payment milestones, estimated system output, maintenance duties, and any fees for changes or cancellation. Compare the production estimate with your household’s past electricity bills, not just a sunny-month snapshot. Make sure the contract explains who arranges permits and inspections, and when the system is expected to be switched on. I might be tempted to skim the fine print when the numbers look good; that is exactly when a second, slower read helps.

Facebook X Instagram Pinterest WhatsApp WhatsApp
We use cookies to improve your experience on our website. By browsing this website, you agree to our use of cookies.